Sales Analysis Dashboard
Version: 150113
Printed Report Title: Sales Analysis Dashboard (in <uom>)
Report Summary
A variety of KPI's with charts to view sales data.
Includes pages for:
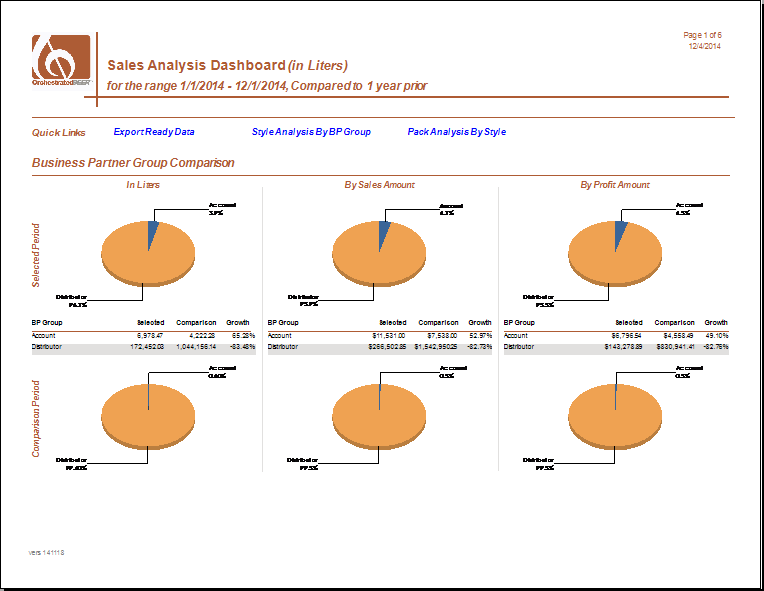
Business Partner Groups
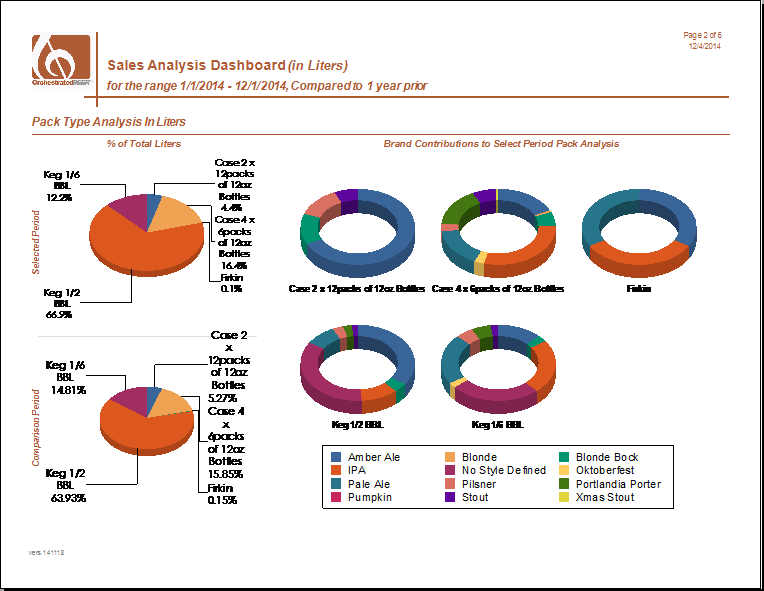
Pack Types
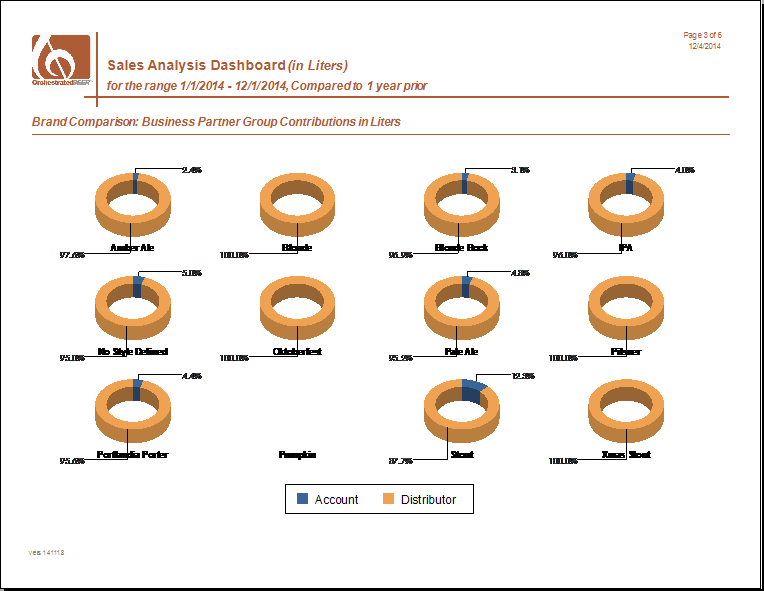
Brand Comparison by Business Partner Group
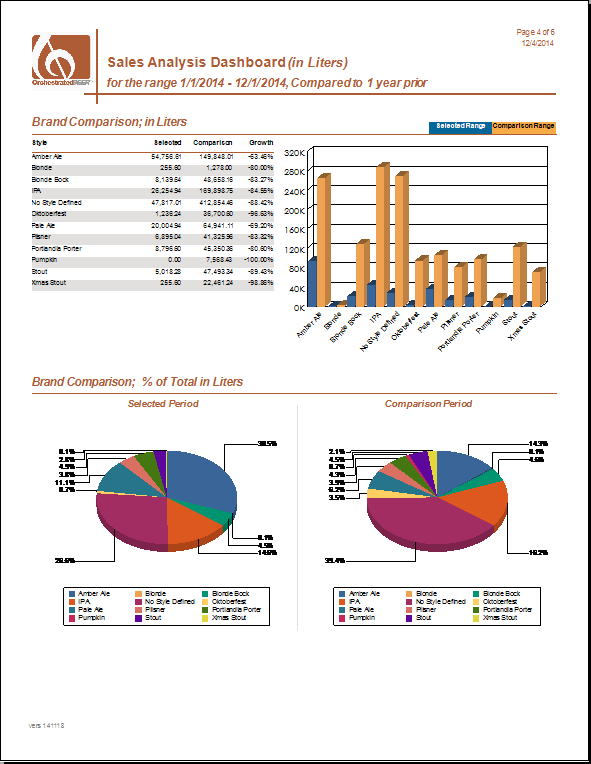
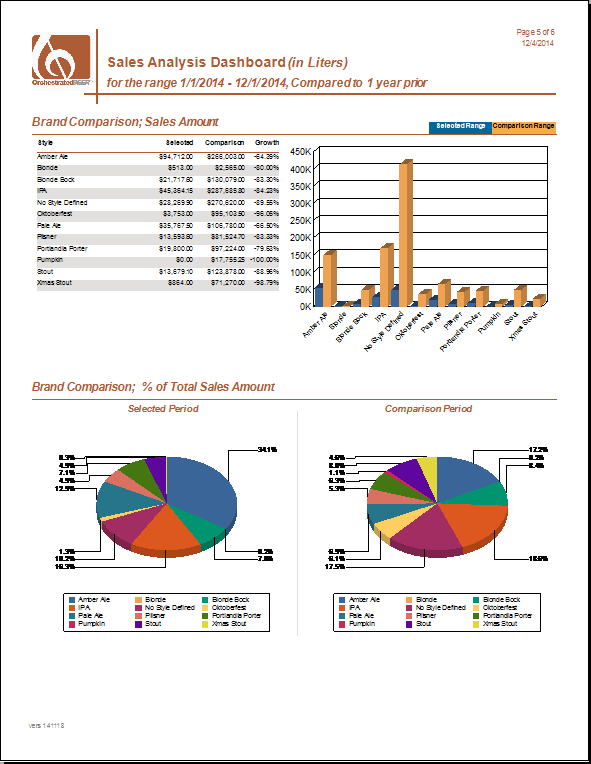
Brand Comparison by volume (in selected unit of measure)
Brand Comparison by sales $
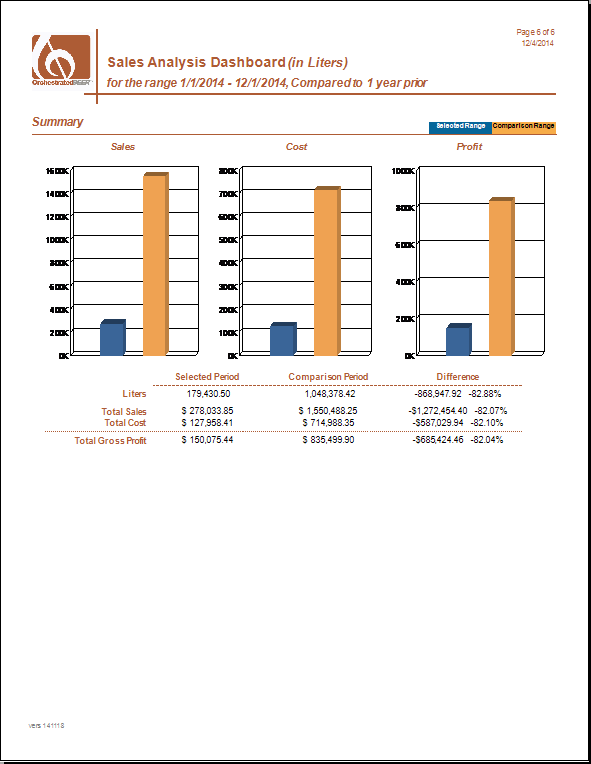
Total Sales with Margin
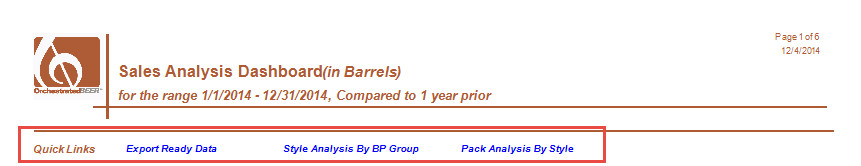
3 Mini Reports are available as quick links at the top of Page 1
Default Location In OBeer
Base Module: Sales - A/R > Sales Reports > Orchestrated Reports
Reports Module: Reports > Sales and Purchasing > Orchestrated Reports (1)
*These are the standard default locations. Your locations may be different.
Typically Used by
Sales Managers and financial stakeholders can review sales volumes and a variety of Sales KPI's.
Key Requirements
Assign Brand codes and Pack types to all beverage sales items.
Tips
Select a "Compare to" range that is at least as large as your current date range.
Example: Select start and end dates that equal a month
A "Compare to" of 1 week would show overlapping or incomplete data.
A "Compare to" of 1 month would give the month preceding the selected range.
A "Compare to" of 1 year will give you the same month one year earlier.
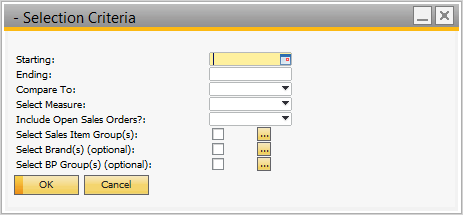
Parameter Entry Options
Required:
Starting and Ending Dates
Compare to (Date range, Choose: 1 year, 3 months, 1 month or 1 week)
Select Measure: (Choose: Case Equivalents, Barrels, Liters, Gallons, Ounces)
Include Open Sales Orders: (Adds in unfilled orders as if they were completed sales )
Select Sales Item Group
Optional:
Select Brands
Select Business Partner Groups
Parameter Entry Image
Report Sample Image (pages 1-6)