AP Price Trends Graph
Summary
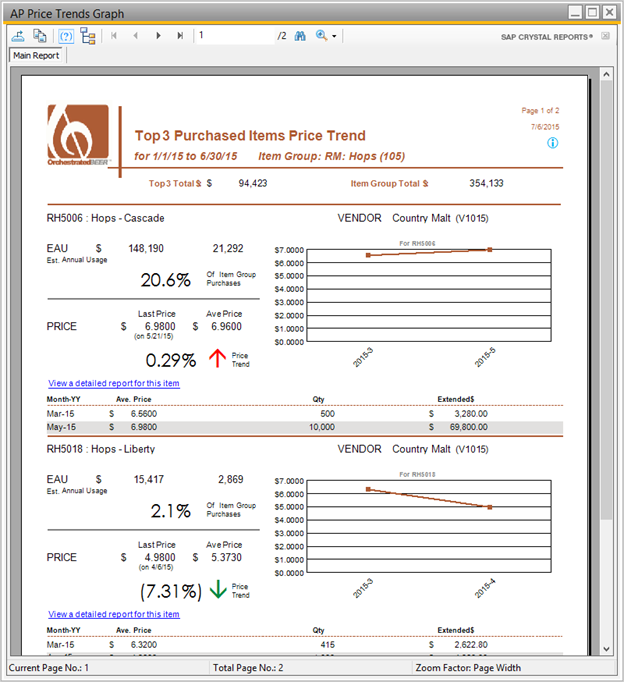
This new report shows the price trends for specific items or item groups. The user can set the report for a period of time and select the top number of items.
Description
Details / How-To
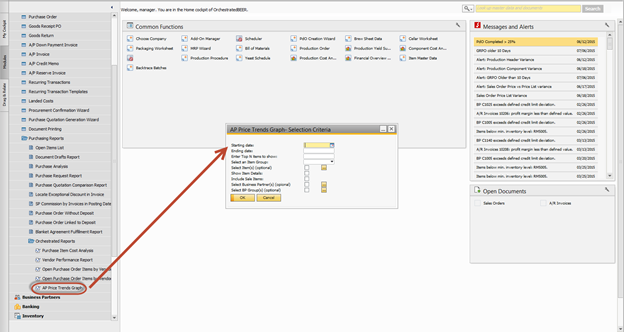
- Navigate to Production → Orchestrated Reports → Purchasing → AP Price Trends Graph
- Input the Starting date and Ending date, then input the Top N (number of) items to show. For example, if you want to see the top three items by purchase price enter "3". Then select an Item Group for the graph criteria.
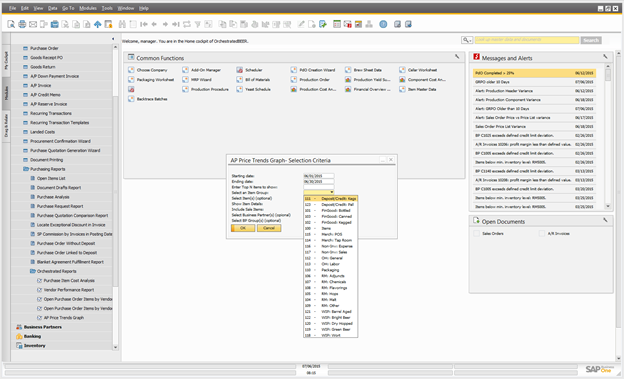
- You also have the option to select specific item(s), show item details, include sale items, select specific business partners or select specific BP Groups.
- Click "Ok" to view the report.