vers 150113
Base Module: Purchasing - A/P > Purchasing Reports > Orchestrated Reports
Reports Module: Reports > Sales and Purchasing > Orchestrated Reports (2)
This page is still under Construction.
...
Summary
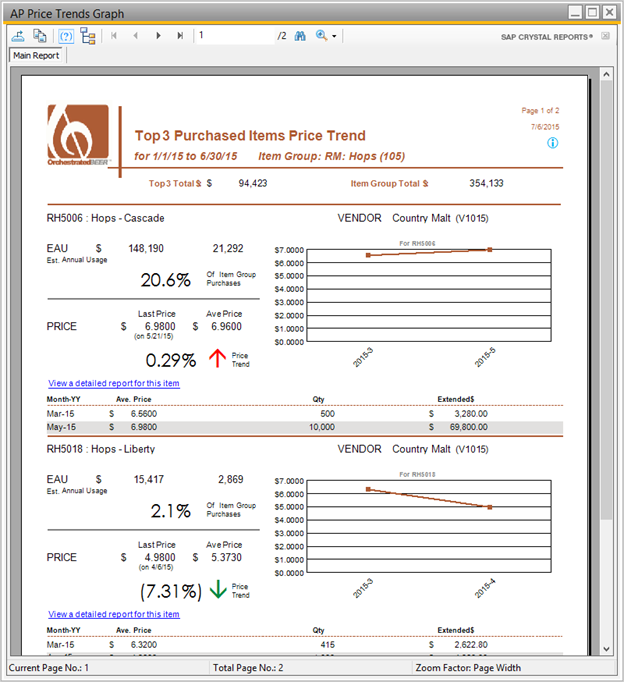
This new report shows the price trends for specific items or item groups. The user can set the report for a period of time and select the top number of items.
Description
Details / How-To
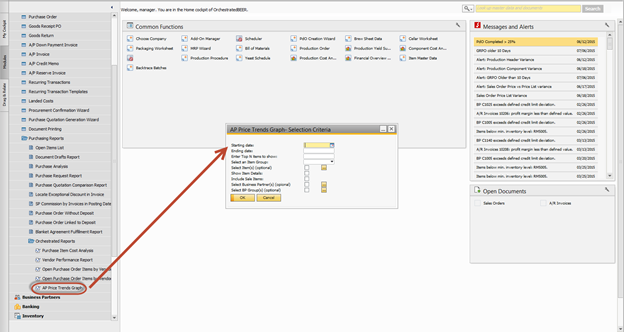
- Navigate to Production → Orchestrated Reports → Purchasing → AP Price Trends Graph
- Input the Starting date and Ending date, then input the Top N (number of) items to show. For example, if you want to see the top three items by purchase price enter "3". Then select an Item Group for the graph criteria.
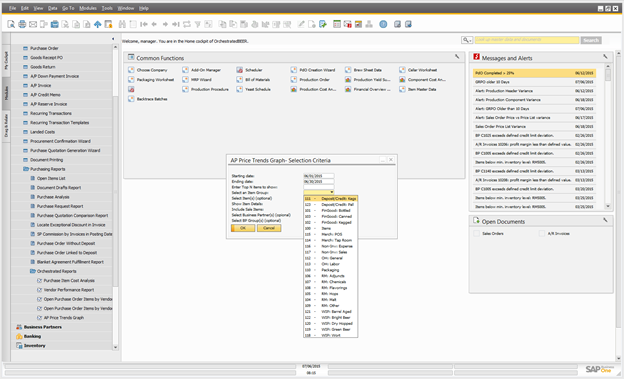
- You also have the option to select specific item(s), show item details, include sale items, select specific business partners or select specific BP Groups.
- Click "Ok" to view the report.